
And that’s it. If you have experience of using these tools in other contexts beware of letting other matters from those contexts drift in. Chances are they don’t apply, or at least not in the way you think.
Examples
Let’s run through some examples of the Stock of Debits and Credit approach.
Here’s the classic MMT view from the UK Accounting document
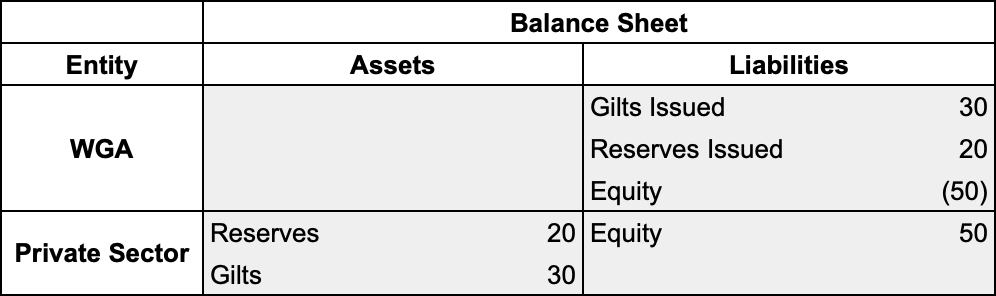
WGA is “Whole of Government Accounts” and consolidates the central bank into the public sector, to which we add a separate consolidation of the private sector to get the view of the entire currency area.
Let’s replace that troublesome defined term ‘Equity’ with something less triggering and more MMT.
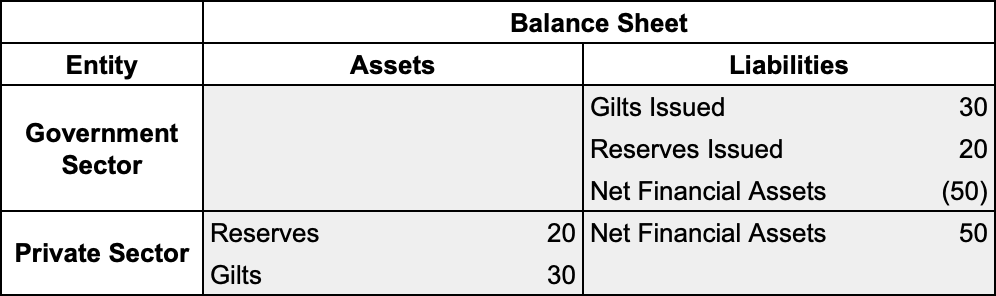
This is the familiar MMT conclusion that a government sector deficit is equal to a non-government sector surplus and that transactions within the private sector do not alter the net financial position of that sector overall. (Macroeconomics, pp95)
However that is a consequence of drawing the dividing line where we have. The line between the sectors is the MMT chosen dividing line which is there to highlight the issues it wishes to analyse. It happens to be the same dividing line the UK takes when defining the scope of the Whole of Government Accounts.
Let’s see what happens when we take that line away.
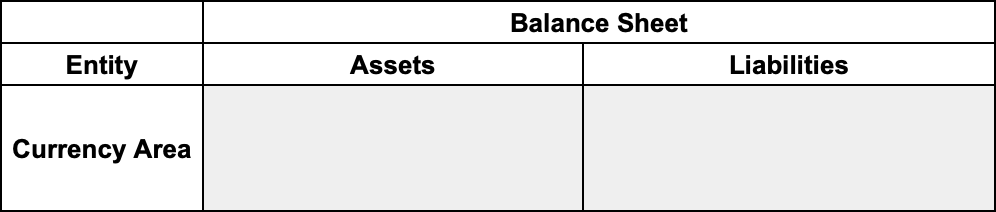
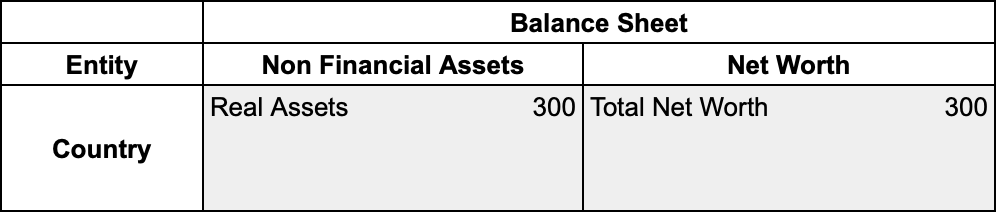
Everything financial in the currency area cancels out and disappears. Now you may think this doesn’t show much, but actually it does - when you add back in the real assets that are missing from the previous balance sheet extracts. (Remember MMT concentrates primarily on the financial part of the balance sheet)
The last two tables are the mainstream view of the financial system. Financials cancel out and disappear. When you run into the interminable debates about “I=S” with mainstream economists remember that they can’t see anything on the financial side and see the last table above as this:
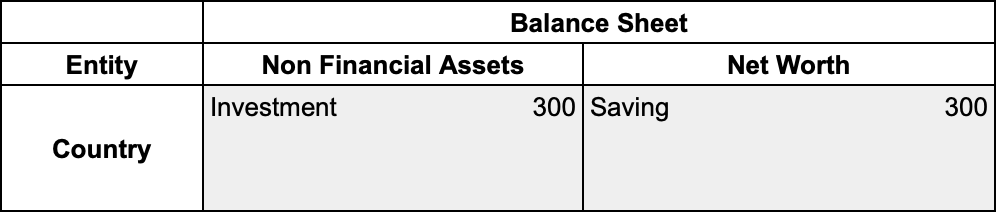
What mainstream tends to do is ignore anything actually financial, turn everything real into units of a denomination and consider the net value of your house and the pile of ice-cream you didn’t sell this summer due to lockdown ‘saving’ not the money you have in a bank account. Once you understand that you’ll know why you end up talking past each other endlessly. You’re looking at the cow from the smiley end and the mainstreamer is looking at the cow from the smelly end.
Now back to the MMT view
Let’s strip away the asset categorisations and go to raw directional descriptions
Here we’ve moved the negative liability in the Consolidated fund to the asset side of the balance sheet - since a negative liability is an asset and a negative asset is a liability. Entries moving side is perfectly normal and expected - depending upon what you want to show or highlight. For example, the Consolidated Fund entry at the Bank of England moves balance sheet sides on a daily basis as it dips and rises above zero.
(Negative liability entries are not uncommon even in end of period reports. ‘Net due to related foreign offices’ at the Fed at the end of 2020 for example).
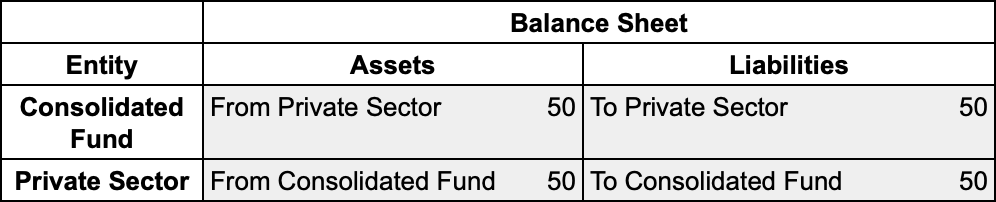
After that we have consolidated the stocks between the sectors. This takes us to an even higher level of abstraction than we normally go with MMT to show the balance sheet expansions that create money out of nothing. In return for financial wealth in the denomination of the Consolidated Fund (ie Sterling), we notionally owe that wealth back to the Consolidated Fund.
This is what the Whole of Government Accounts means when it reports its balancing item as “Total liabilities to be funded by future revenues”. It doesn’t mean that tax rates are going to have to go up. It means those Net Financial Assets are notionally owed back to the Consolidated Fund at some point. A notional that would become a real via the imposition of a wealth tax, for example, since to reduce the size of the balance sheet from 50 to 30, say, requires reducing all four quadrants of the balance sheet by 20. All that would do is make sure the Private Sector has fewer Net Financial Assets. It wouldn’t alter the financial capacity of the UK government one iota.
Fewer Net Financial Assets means less income flowing to the private sector from government, which you may consider a good thing - assuming you believe that private pension funds really do need to be paying their pensioners with only private income and should go bust if they can’t. If you don’t believe that then it may be time to ask yourself if you’ve thought through all the cascade effects of what you’re proposing. The debits and credits don’t lie.
Implications
When we use balance sheets to illustrate points in MMT analysis, it’s important to remember that we are using bookkeeping tools to do stock/flow analysis of a currency area, not drawing up a set of accounts.
Standard accounting is designed to report on an entity to a set of owners, and there is an ever changing set of standards that try and ensure that represents a ‘true and fair view’ of the entity from the point of view of the owners. That leads to a set of biases.
The report is in a reporting currency, which means that anything held by the entity in a different denomination is converted into the reporting currency and reported as though it was held in the reporting currency. Those have to be removed to do currency area analysis or you introduce fixed exchange rate thinking by the back door. In a floating rate system entities sit in multiple currency areas. When MMT analysis talks about an entity, it will mostly be one of those currency area subsets of the entity it is talking about, not the entire entity.
The reports can have a geographical boundary, often with the reporting boundary around a country’s borders. However in a free capital floating exchange rate system many entities who hold a denomination sit outside that geographical area. The Norwegian Pension Fund Global is part of the sterling currency area for example. You have to collect those and add them back in to get a view of the currency area, otherwise again you’ll introduce fixed exchange rate artefacts into the analysis.
When you are reporting to a set of owners you want to decide what is owed to third parties and what is owed to (i.e. owned by) the owners. This leads to the traditional split between ‘liability’ and ‘capital/equity’ and a whole mountain of argument about how to do that, all of which is fundamentally arbitrary. (See the bank regulatory view and accounting view of a fixed term preference share for example - which shows the tension between the ‘regulator’ view and the ‘owner’ view)
None of that really applies when you’re doing stock/flow analysis. We have “Assets” and we have “Liabilities” and that’s it. If you prefer, call them “Stock of Debits” and “Stock of Credits”. All that matters is that the stocks match, and they sum to zero, and that any flow journals you apply maintain that position. Then you know you haven’t missed anything.
To do any reasonable analysis, when flows are expected to flow is the key and that needs to be granular and targeted at the particular analysis being undertaken rather than shoehorning into a maturity profile that has more to do with assessing the solvency of an entity than the structure of an economy.
Standard accounts include ‘real assets’, again valued in the reporting currency. There’s a couple of effects of that. The first is to homogenize heterogenous capital assets and make them seem interchangeable (cows and helicopters both end up described as a quantity of a denomination), which they are not as the Capital Debates explained, and the second is that to have Net Worth you have to include the real assets. However when we are doing stock/flow analysis in Modern Monetary Theory (the clue’s in the name) we generally concentrate on the financial subset of the whole balance sheet. Therefore the balancing item on an MMT stock/flow analysis is just a Balancing Liability (or Balancing Stock of Credits if you prefer), not Net Worth as we see in the National Accounts.
It’s important to avoid a “firm analogy” fallacy that is almost as damaging as the “household analogy” fallacy. Currency zones are neither households nor firms, and should not be analysed as such.